


Email Marketing Guide: How to analyse the results of a hotel email marketing campaign (II)
By unifying the data provided in the CRM and Google Analytics, you will have a complete picture of how your email marketing strategy is working.

Nowadays, many tools that help us read and analyse what is happening on our website or the performance of marketing actions. Still, without a doubt, Google Analytics (GA) will always be the quintessential “tool”.
The essential and fundamental thing in order to measure the results of an email marketing campaign is to have implemented a UTM* or tracking code that distinguishes the action itself. For example, sending a campaign to 10,000 emails is of little use if we cannot tell what happened to that mailing.
This data that GA provides you with will help you analyse the impact of your campaign, but you will also need other statistical parameters for a more in-depth analysis and you will have them in your hotel CRM.
Keep in mind that we can do countless analyses of the same email marketing campaign, but here are the key points to measure:
- Number of submissions: Total number of emails sent.
- Percentage of successful deliveries: Those that have reached the inbox.
- Bounce rate: Those that could not be delivered for some reason.
- Open rate: out of the total emails sent, those that have been opened.
- Click-through rate: out of the total emails opened, those that have been clicked on.
- Conversion rate: of the emails that obtained reservations or met a goal.
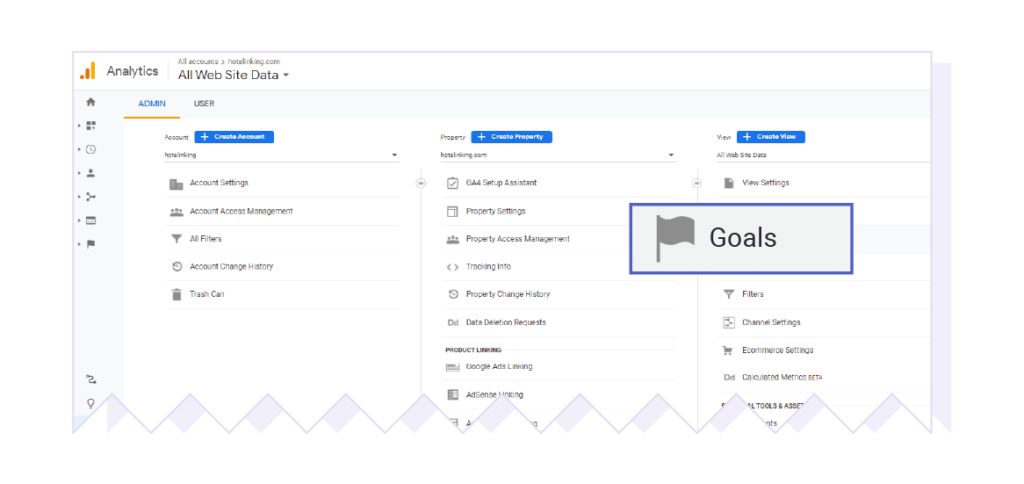
Goals
First of all, you must define your goals in Google Analytics. Then, with the goals or events that we have defined, we can compare the campaigns to find out which one performed best and how many goals were met per campaign… This can give us interesting tips and ideas for future campaigns and thus get better results, if possible.
In this set-up, we will see that you can define various types of goals: revenue, acquisition, query and interaction; which will allow us to create not only revenue and reservation-related goals, but also set up lead generation goals, such as submitting the contact form, reaching a certain destination website or spending a certain amount of time browsing the web.
In order to create goals or events, we access the “Admin” section of Google Analytics and in the third column, “View”, we will locate “Goals”.
When you access this section, you will see the option to create “New Goal” and you can choose “Template” or “Customise”. We will use the second one.
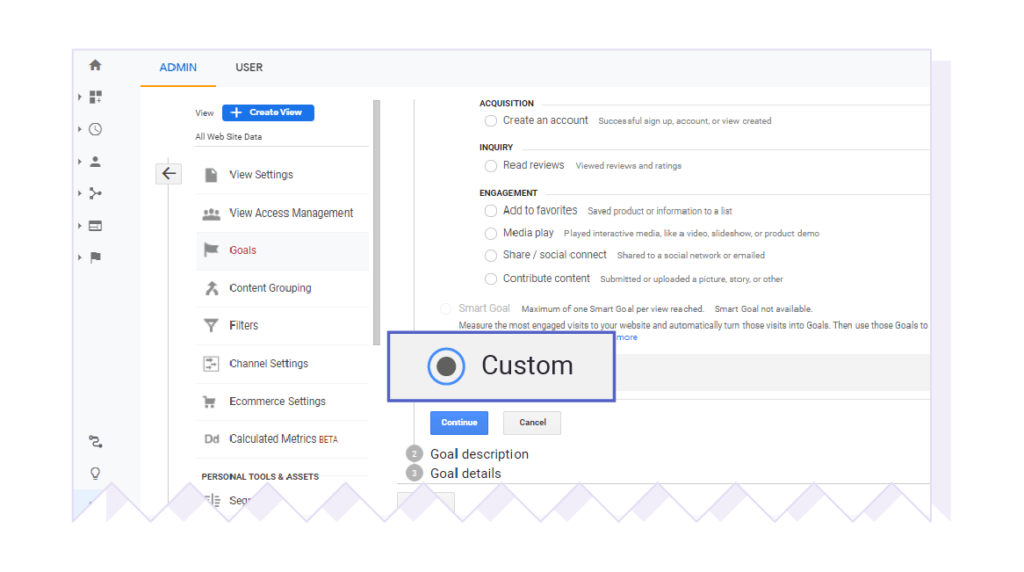
To customise it, it will request a goal name, for example, “Newsletter Opening” and we select the “Goal Type”, since there are four options: “Destination”, “Duration”, “Sites per session” and “Event”.
- Destination: which destination site we would like to measure: For example “gracias.html”
- Duration: if we were interested to know if they have spent more than X time on our website.
- Pages per session: if you want to know if they have viewed more than X sites per session.
- Event: if they have performed a specific action that interests us (PDF download, watched a video…)
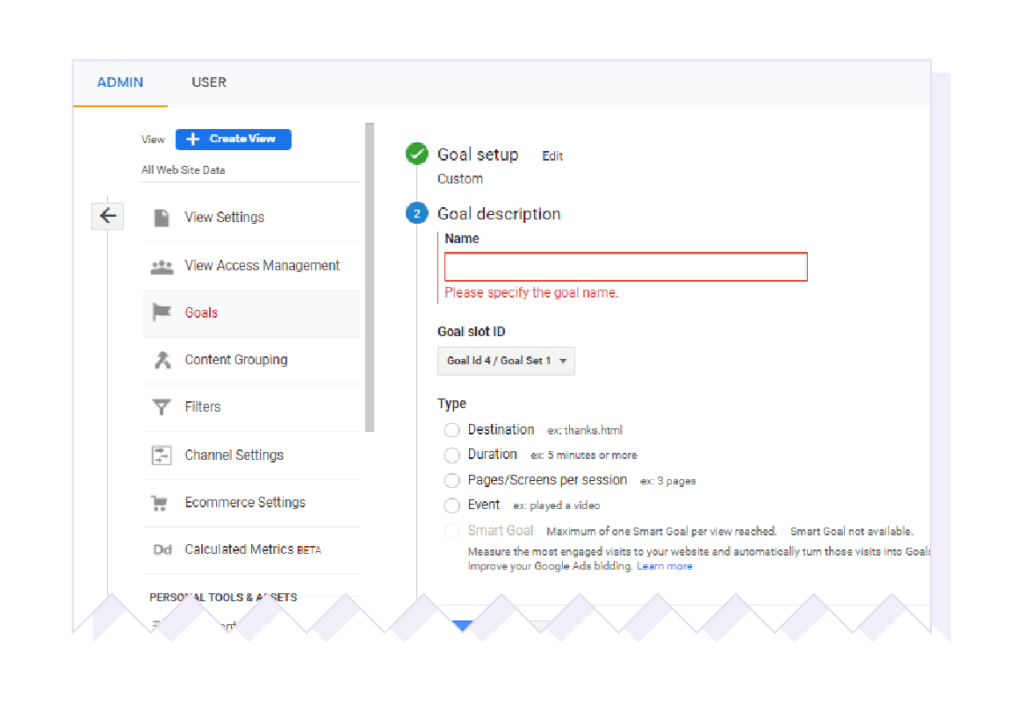
We select the one that interests us the most according to what we want to measure and validate. We will be able to see whether events would have been generated in the last seven days with our set-up.
To analyse the data, we can do it from different areas of Google Analytics. So let’s look at different areas and how to access them.
Acquisition
We go to the left side menu and under “Acquisition”, we access “All Traffic/Channels”. Quite a lot of data will appear in the columns, so we must filter on “Secondary Dimension: Campaign”.
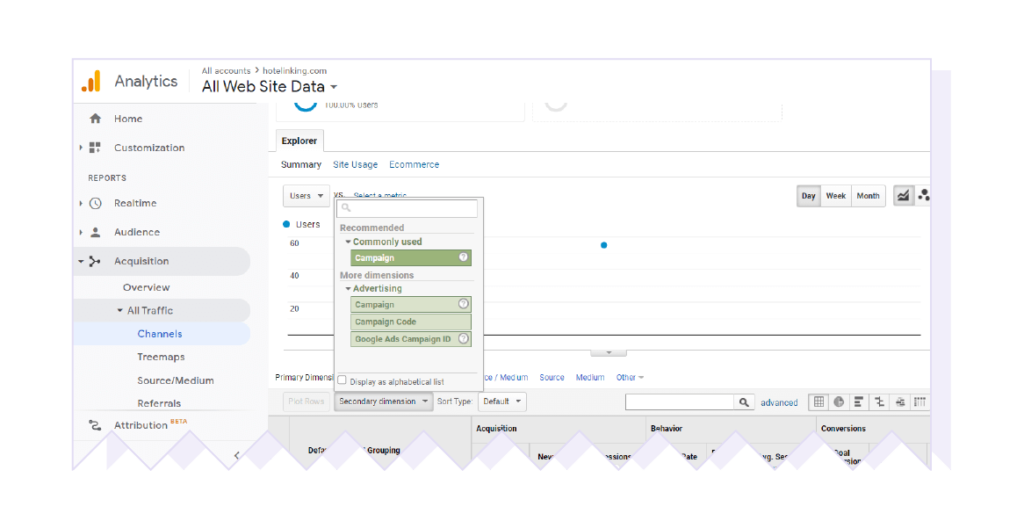
Even so, we will continue to receive a lot of data that in this case does not interest us, because we want to focus on the analysis of email marketing.
So we’ll have to go to the filter and select “mailing” so that only email campaigns appear.
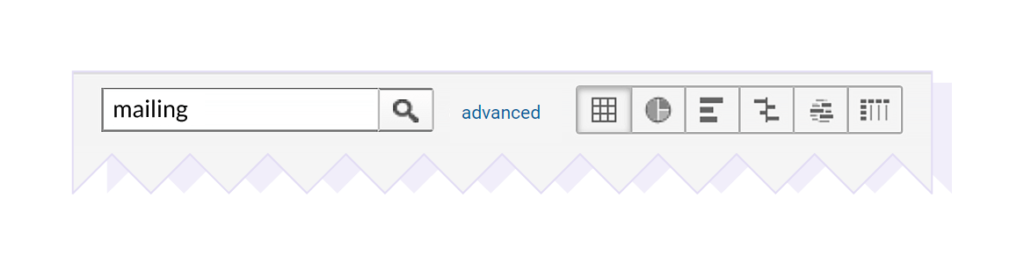
If you want to filter even more by a specific campaign, we will go to the “Advanced” filter and specify the campaign that contains part of the name we indicated when we created it and apply changes. In this way, we view the data corresponding to the campaign in question in an easier and more straightforward way in the columns.
In this tab, we can indicate the goal data we want to be shown in the columns, since we had previously created the goals of our interest.
In the columns we will see, apart from the Source (“mailing”) and the Campaign, the columns divided into three parts: “Acquisition”, “Behaviour” and “Conversions”.
Acquisition:
1. Users: Users who have logged in to our site through our campaign, within the date range we have indicated in Google Analytics. We must keep in mind that by default, GA will always show us the last seven days.
2. New users: Number of new users during the indicated period.
3. Sessions: Total number of sessions during that period.
Behaviour:
1. Bounce rate: The bounce rate of a single site where the user has not interacted.
2. Pages/Session: Average number of pages viewed per session. All pages viewed in the same session are also counted.
3. Average session length: The average duration of a session.
Conversions:
1. Goal conversion rate: The percentage of sessions that have generated a conversion.
2. Transactions: Total number of goals achieved on the website.
3. Revenue: If you have entered a goal value, it will show us the total revenue earned through the goal.
Behaviour
Another interesting fact that we can see is how the users we sent the email campaign to have interacted on our website.
For that, we will do the following:
In the “Behaviour” section, we access “Site Content” and within it “All Pages”. Just as in the “Acquisition” section, we must filter the view to show us only what we want to analyse.
This time it will be “Secondary Dimension”: “Source/Medium.”
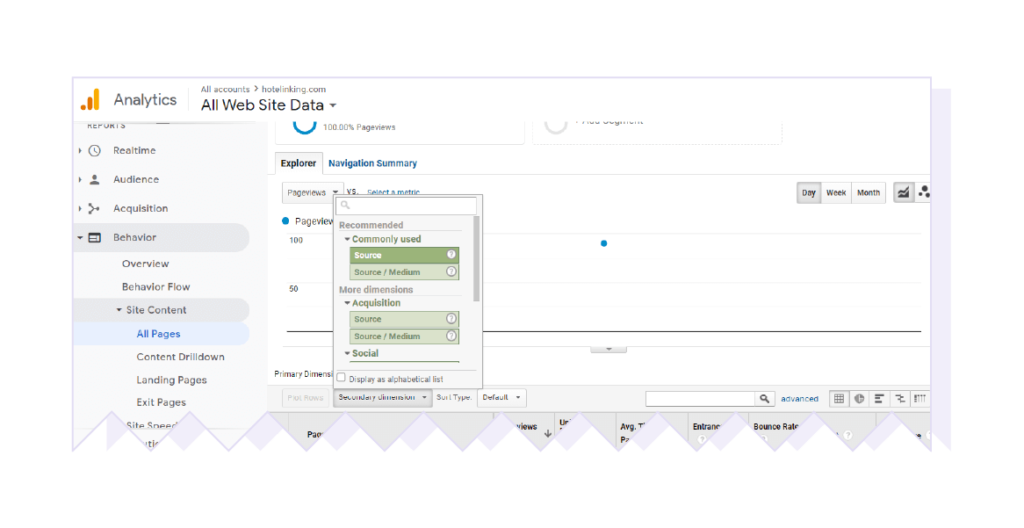
And in the “Advanced” filter we will indicate that the “Source” contains “Mailing” to be able to see only that information.
Here we will see other columns that will show us the following data:
- Number of site views: The total number of site views. It also counts repeat visits to the same page.
- Number of unique site views: The total number of sessions during which a specific site has been viewed at least once.
- Average time on site: The average time users viewed a given site or set of sites.
- Entries: Number of times they have accessed our website from a given page or pages.
- Bounce rate: The percentage of single-page sessions where they have not interacted.
- Percentage of exits: Percentage of exits from our website from a given site or sites.
- Site value: Average value of the site or sites. (Revenue per conversion + total target value/number of unique site views.)
As we can see, there are plenty of options, screens, graphs and variants that would keep us for hours and hours in front of the screen and, even so, there would always be information to look at and analyse. In the following article, we will delve into how to analyse conversions.
*A UTM is a code made up of small pieces of text that are added to the end of a URL and that allow us to track the success of certain content on the web.